Know what broke in your data before Monday's standup
Connect every source, surface every anomaly, send every executive report — automatically. No SQL. No data engineers. No stitching together five tools that do not talk to each other.
- AcmeCorp
- GlobalTech
- NexusSaaS
- CloudScale
- DataFlow
- MetricHub
- GrowthEngine
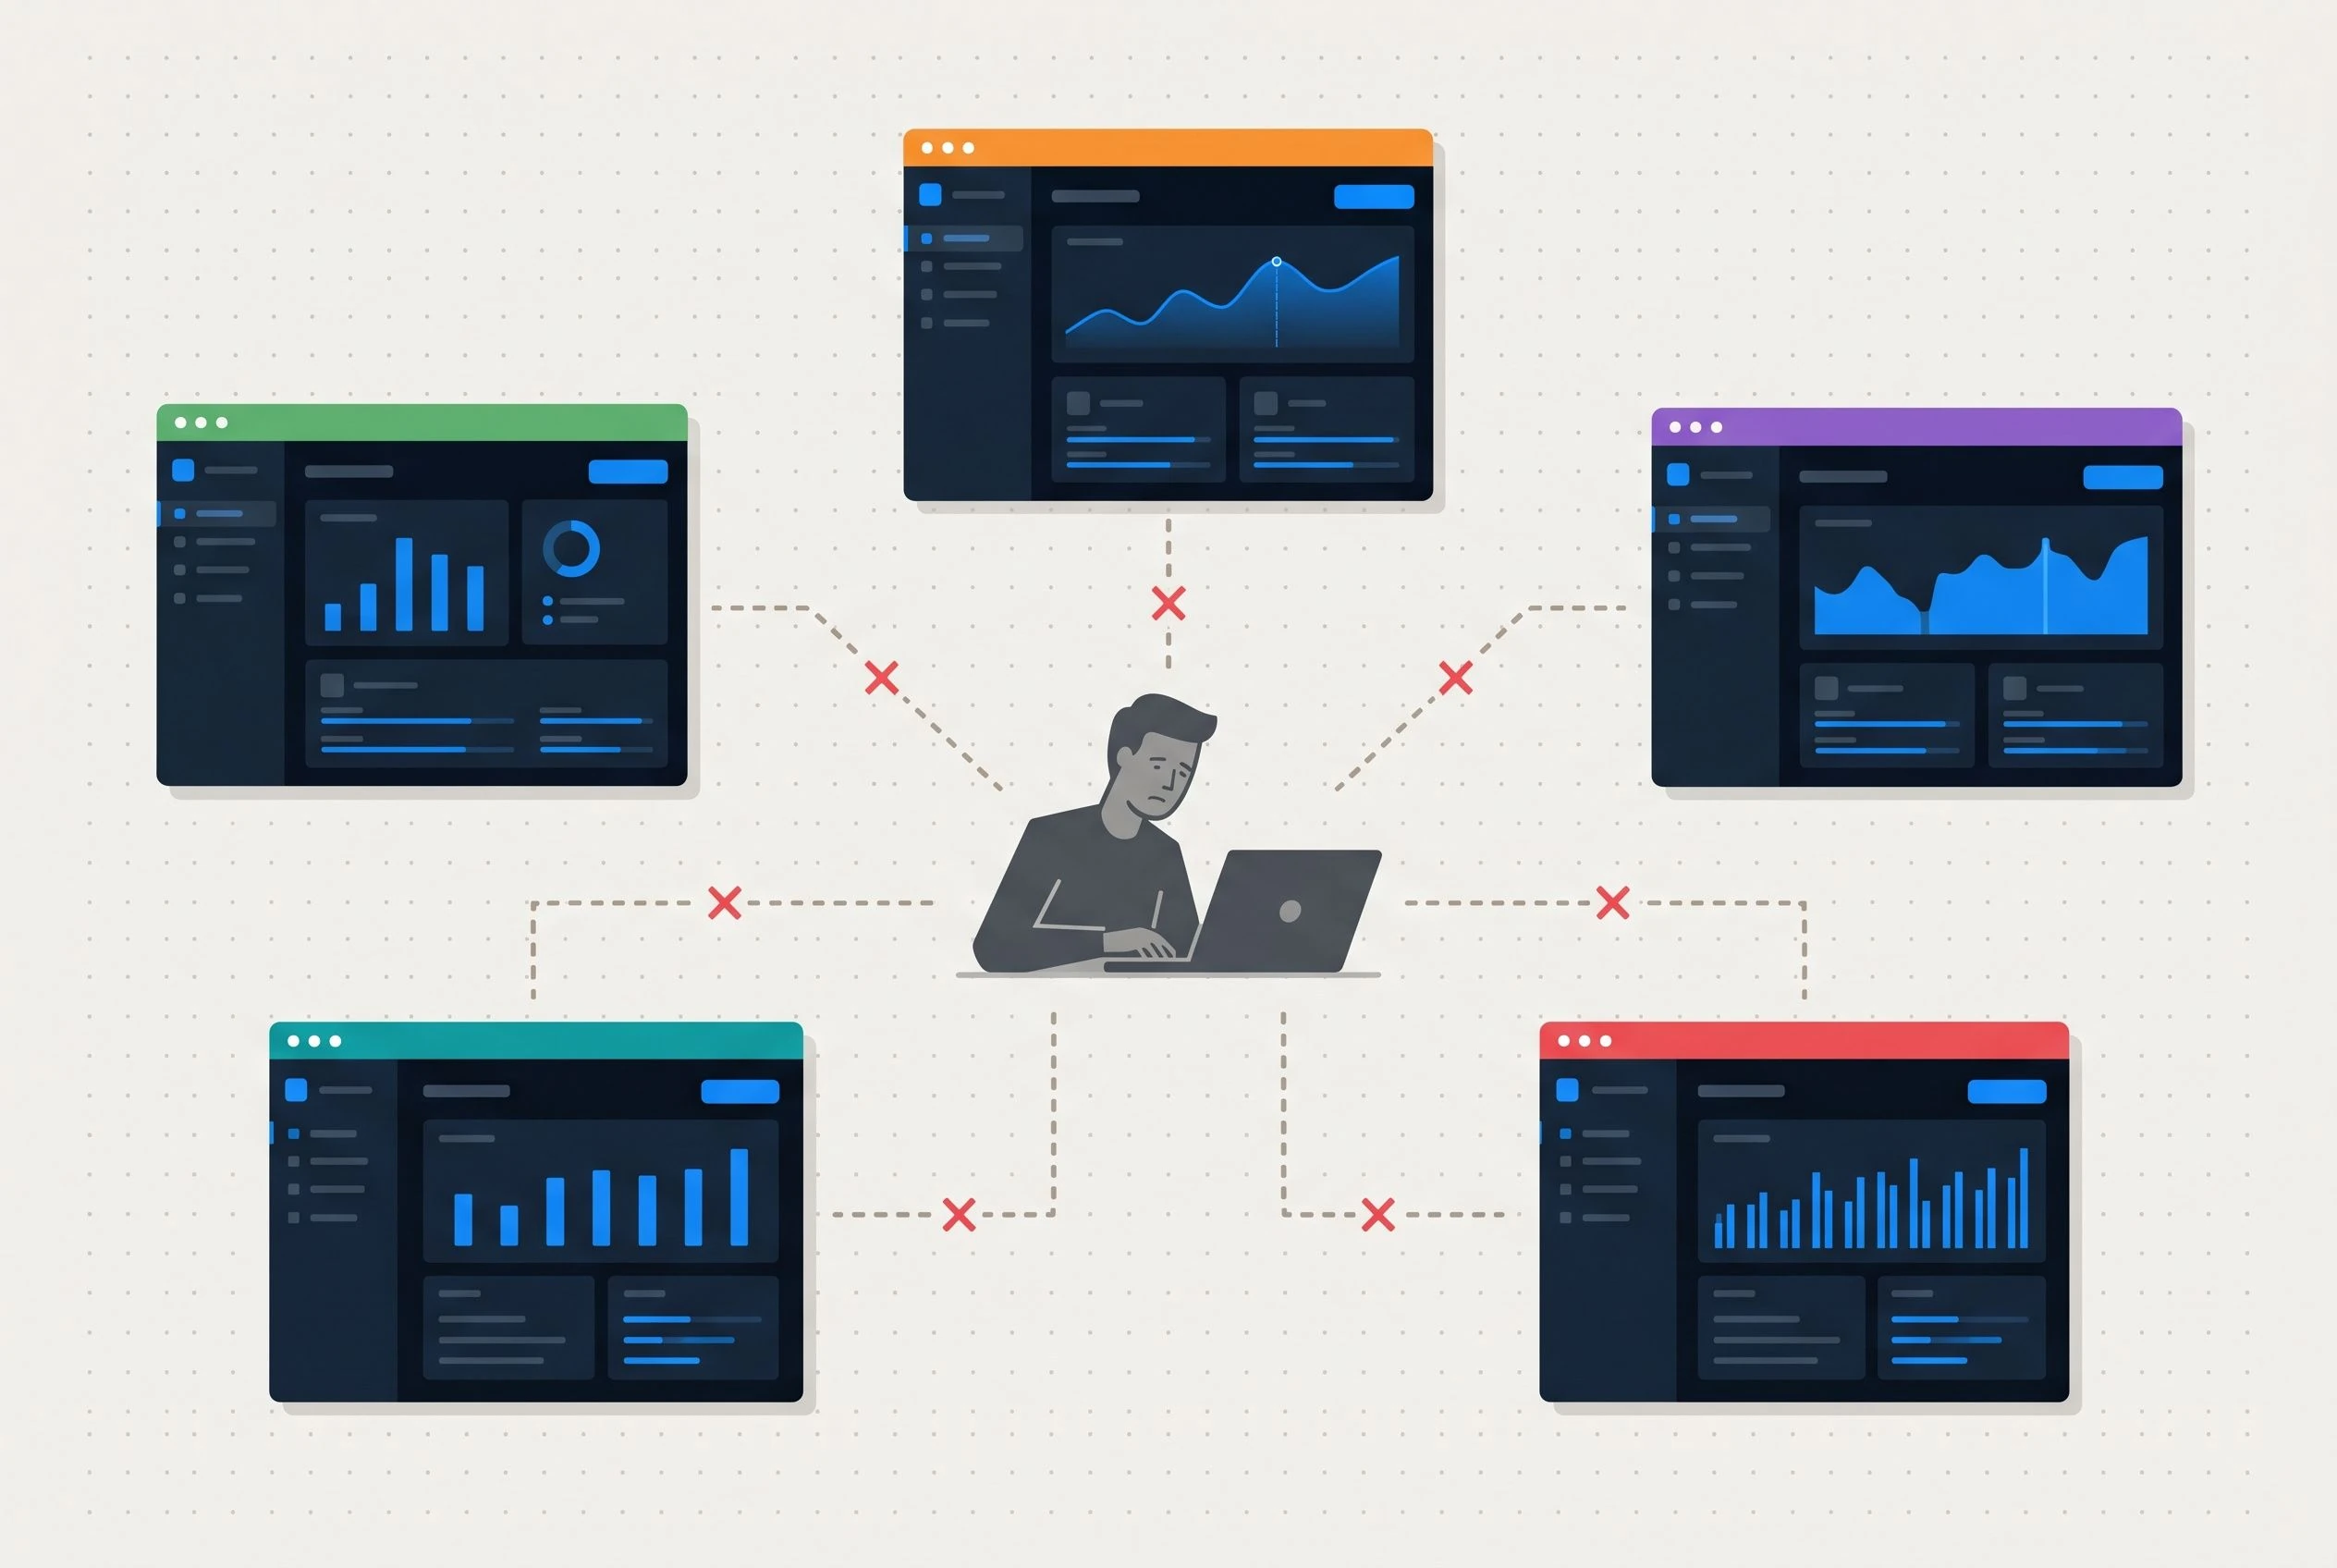
Your current stack is not a system — it is a weekly negotiation between five tools that do not talk to each other.
The average mid-market marketing ops team runs 28 tools and reconciles them manually. Every Monday standup starts with the same question: "Why are the numbers different in Salesforce and in the spreadsheet?"
The old way
Five disconnected tools. Five export jobs. One very stressed operator trying to make them agree before the 9 AM standup.
of marketing leaders identified assessing campaign effectiveness as their single biggest operational challenge in 2025 — not budget constraints, not headcount. The numbers themselves.
Data that contradicts itself
Your Salesforce pipeline total and your analytics attribution report have never agreed on a single quarter. Both feel authoritative. Neither is. Your CEO notices.
Six to ten hours gone every week
That is not reporting time — that is data-reconciliation time. Pulling, formatting, cross-checking, and rebuilding the same numbers your tools should already be sharing.
Attribution that belongs to everyone
Three platforms claim credit for the same conversion. You present whichever version makes the most sense in the room. That is not analysis. That is performance.
Teams that move to a single command center reclaim their Monday mornings — and catch problems on Friday afternoon instead.
Reduction in reporting prep time
Median time savings in weekly reporting hours among mid-market SaaS teams in their first full quarter on the platform.
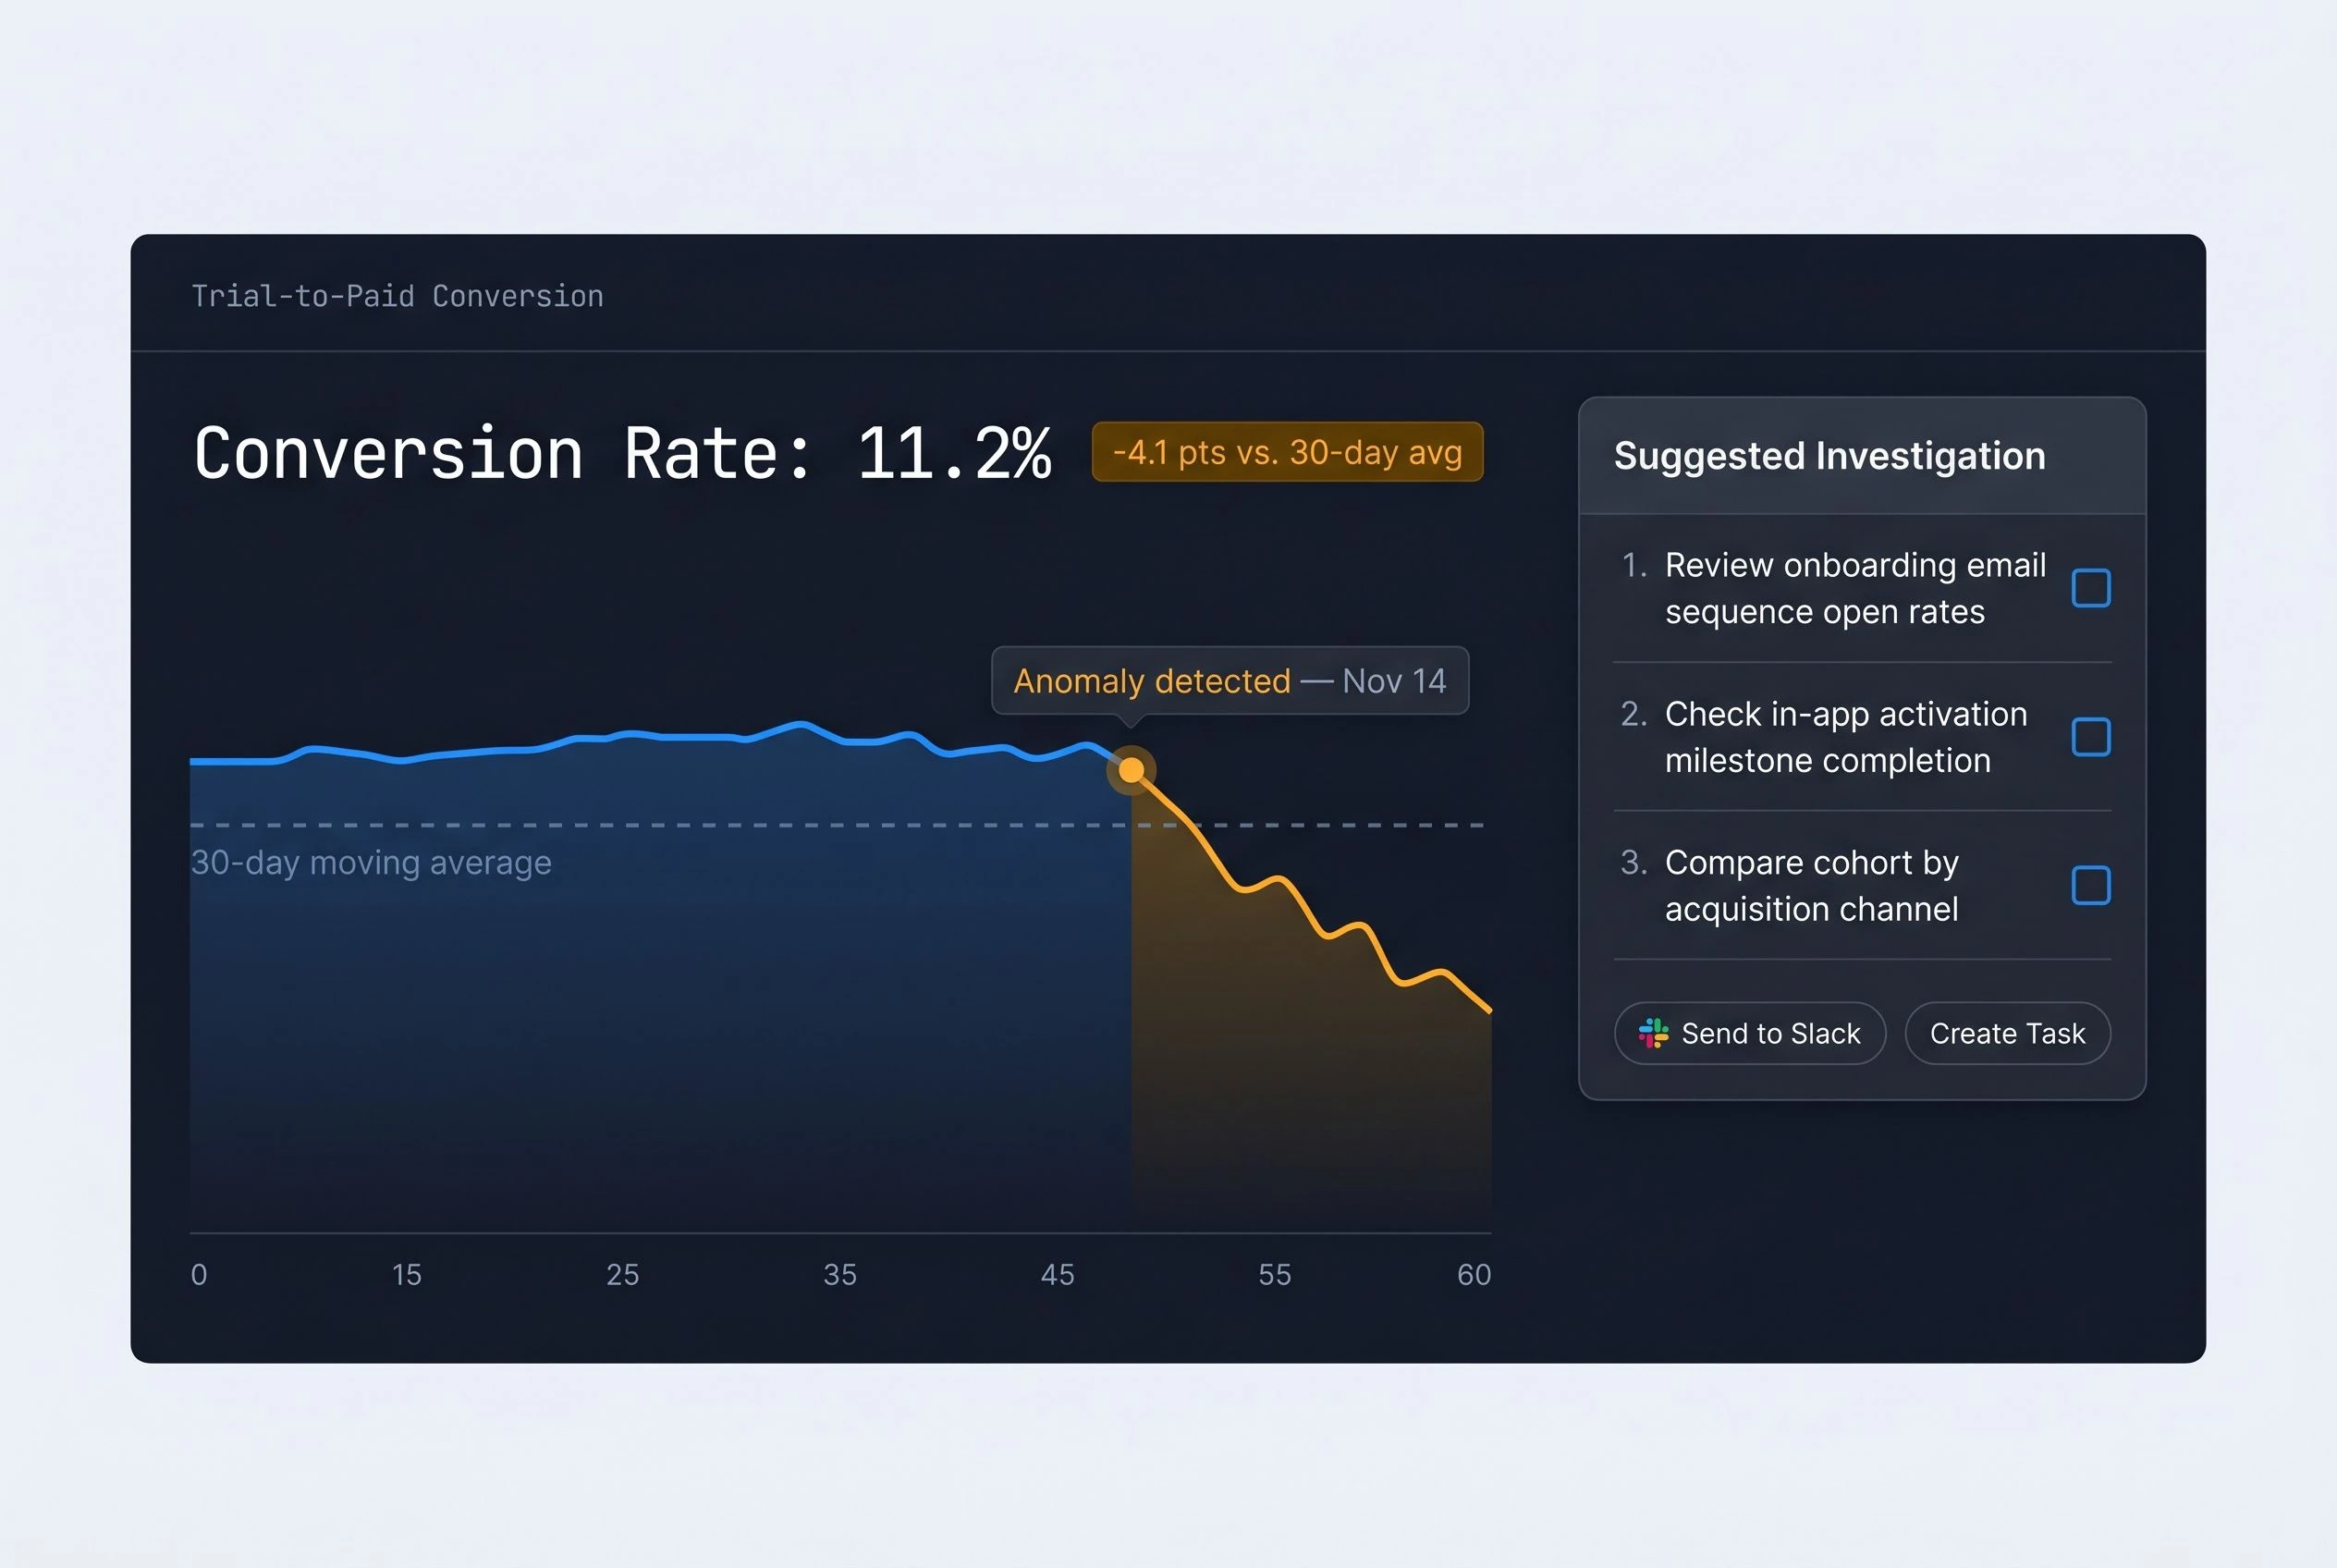
Earlier warning on KPI drops
Anomaly alerts fire an average of 2.3 days before the same issue would have surfaced through manual dashboard review.
Returned to strategy work
Average hours reclaimed per team member per week once automated reporting replaces manual data assembly.
"The first week we caught a paid search budget pacing issue on Wednesday afternoon. Previously we would have seen it in the Monday debrief — after the damage was already done."
One command center. Every source connected. Every change caught. Every report written for you.
Unified KPI Dashboard
Connect HubSpot, Salesforce, Google Analytics, Stripe, Mixpanel, and 60+ additional sources in under 60 minutes. No query language. No ETL pipeline. No engineering ticket. Your full KPI picture is live on page open — not after someone spends four hours building it from scratch.
See This Live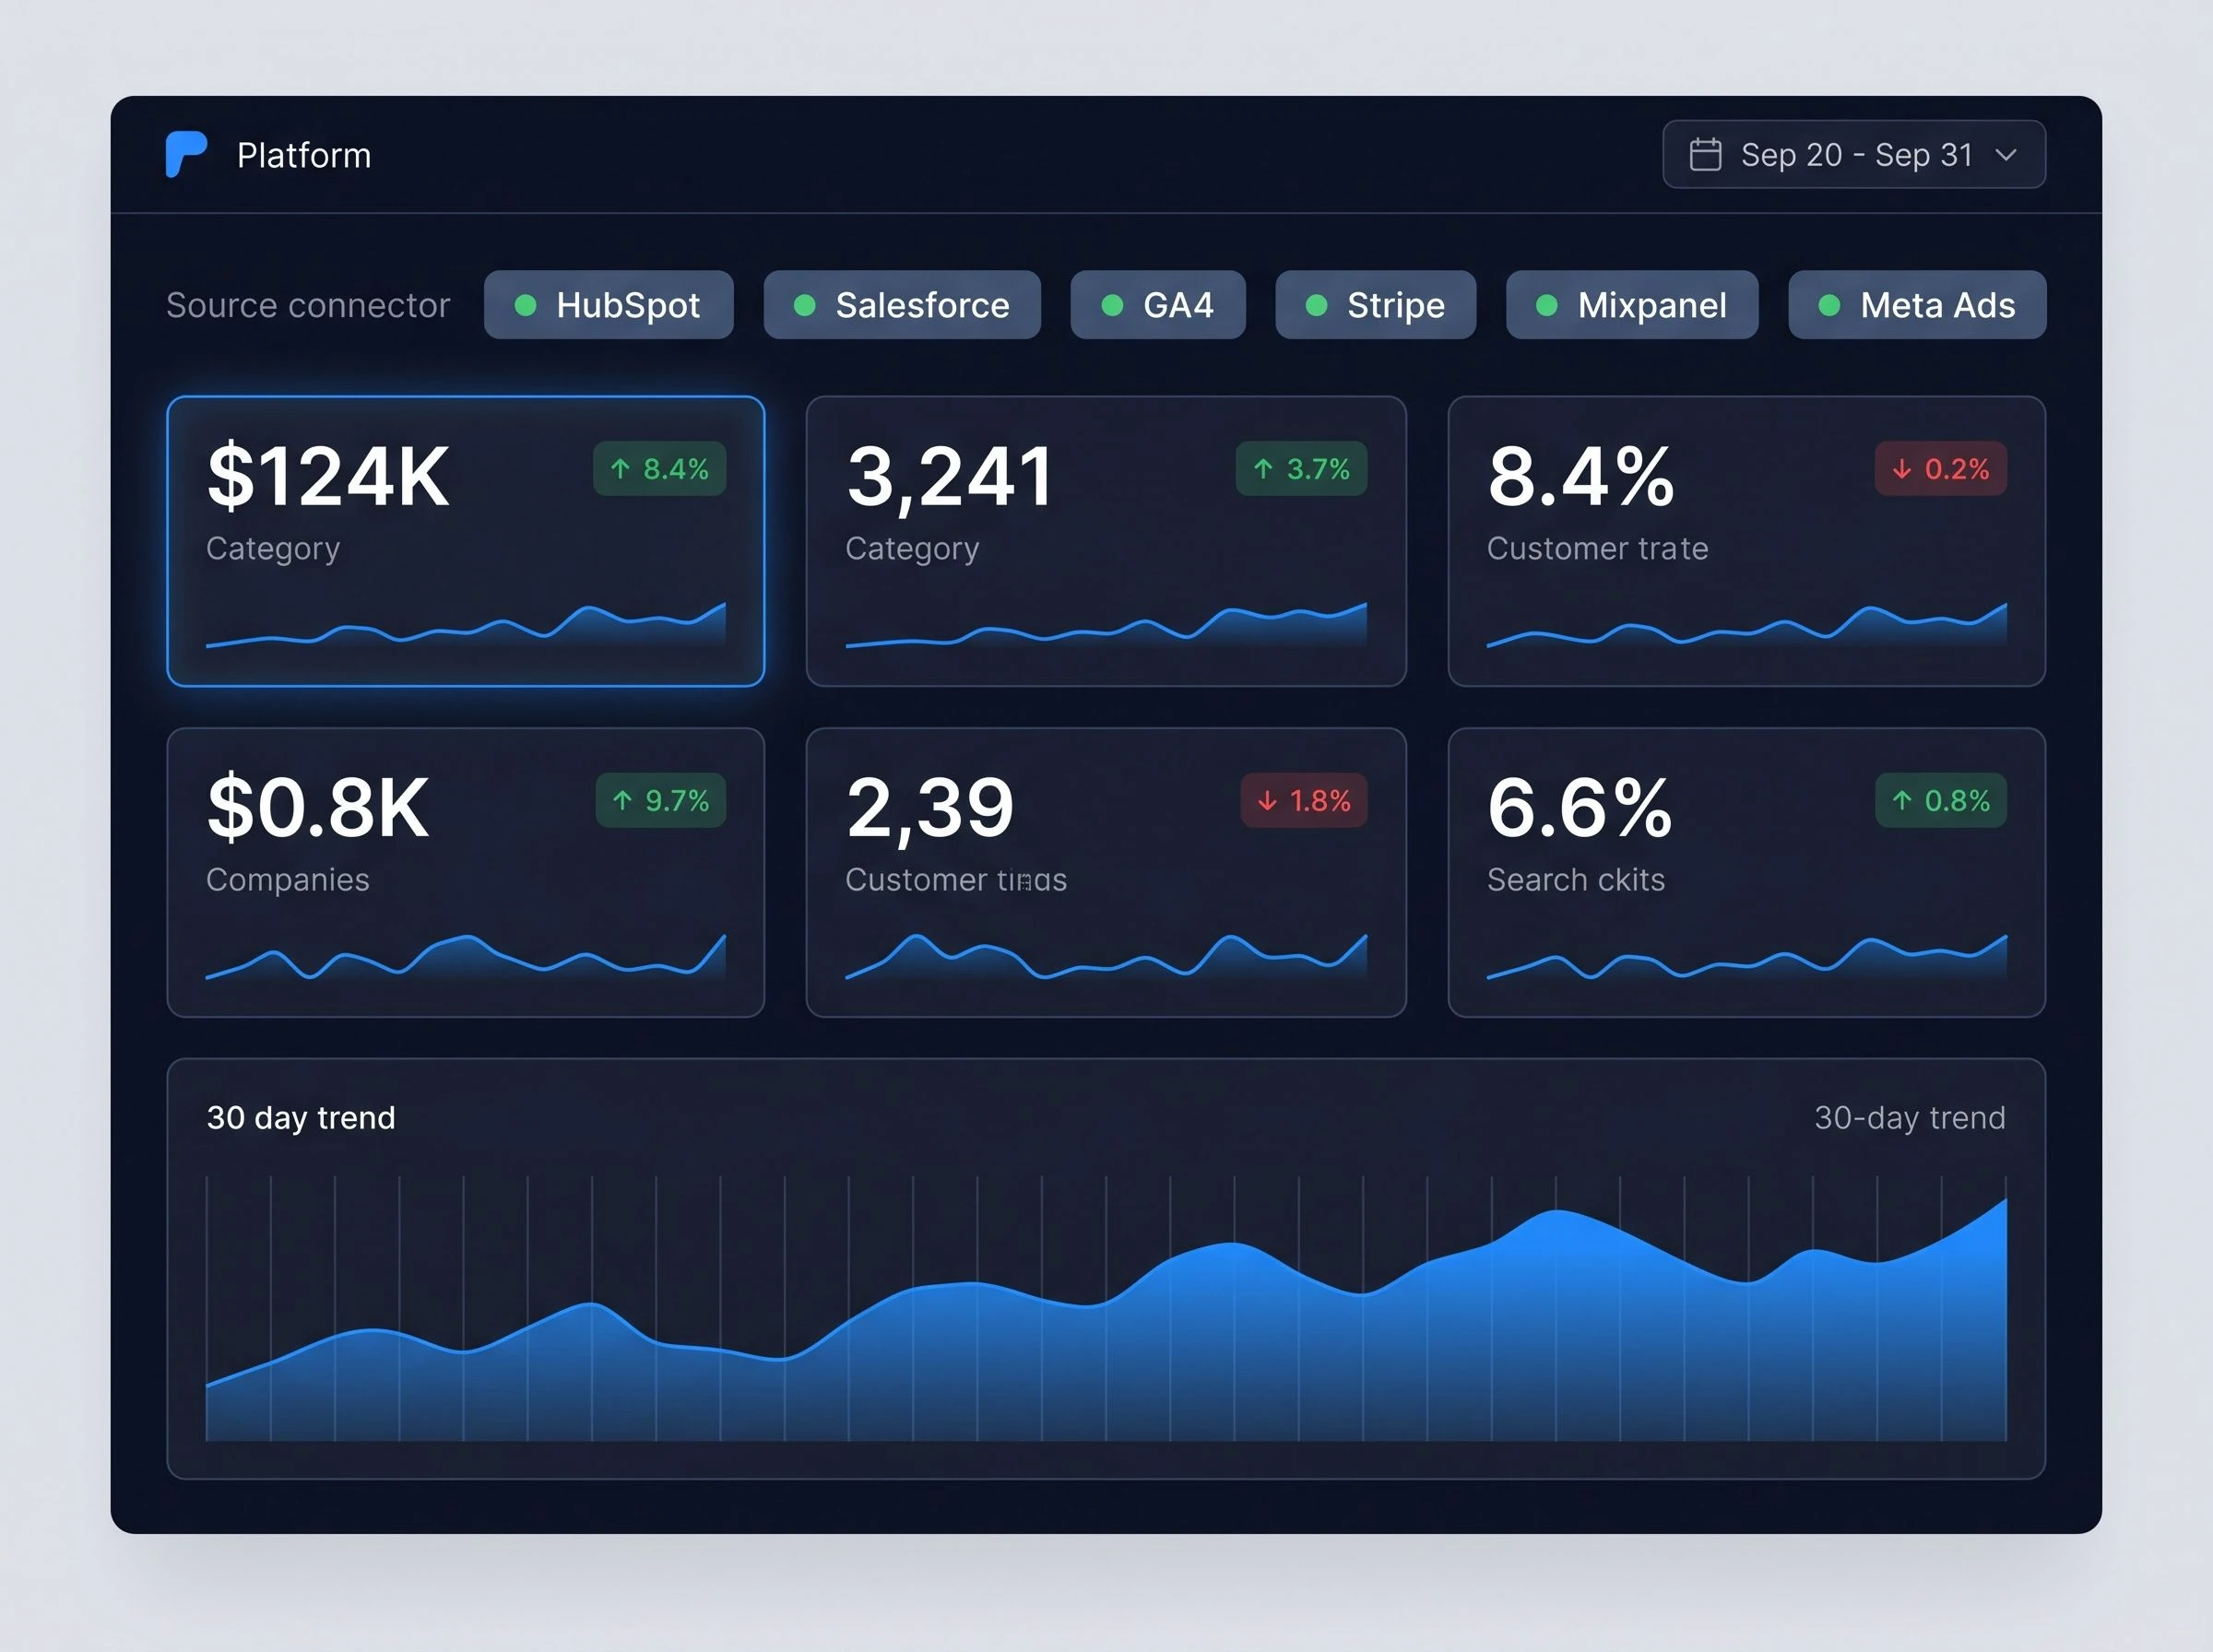
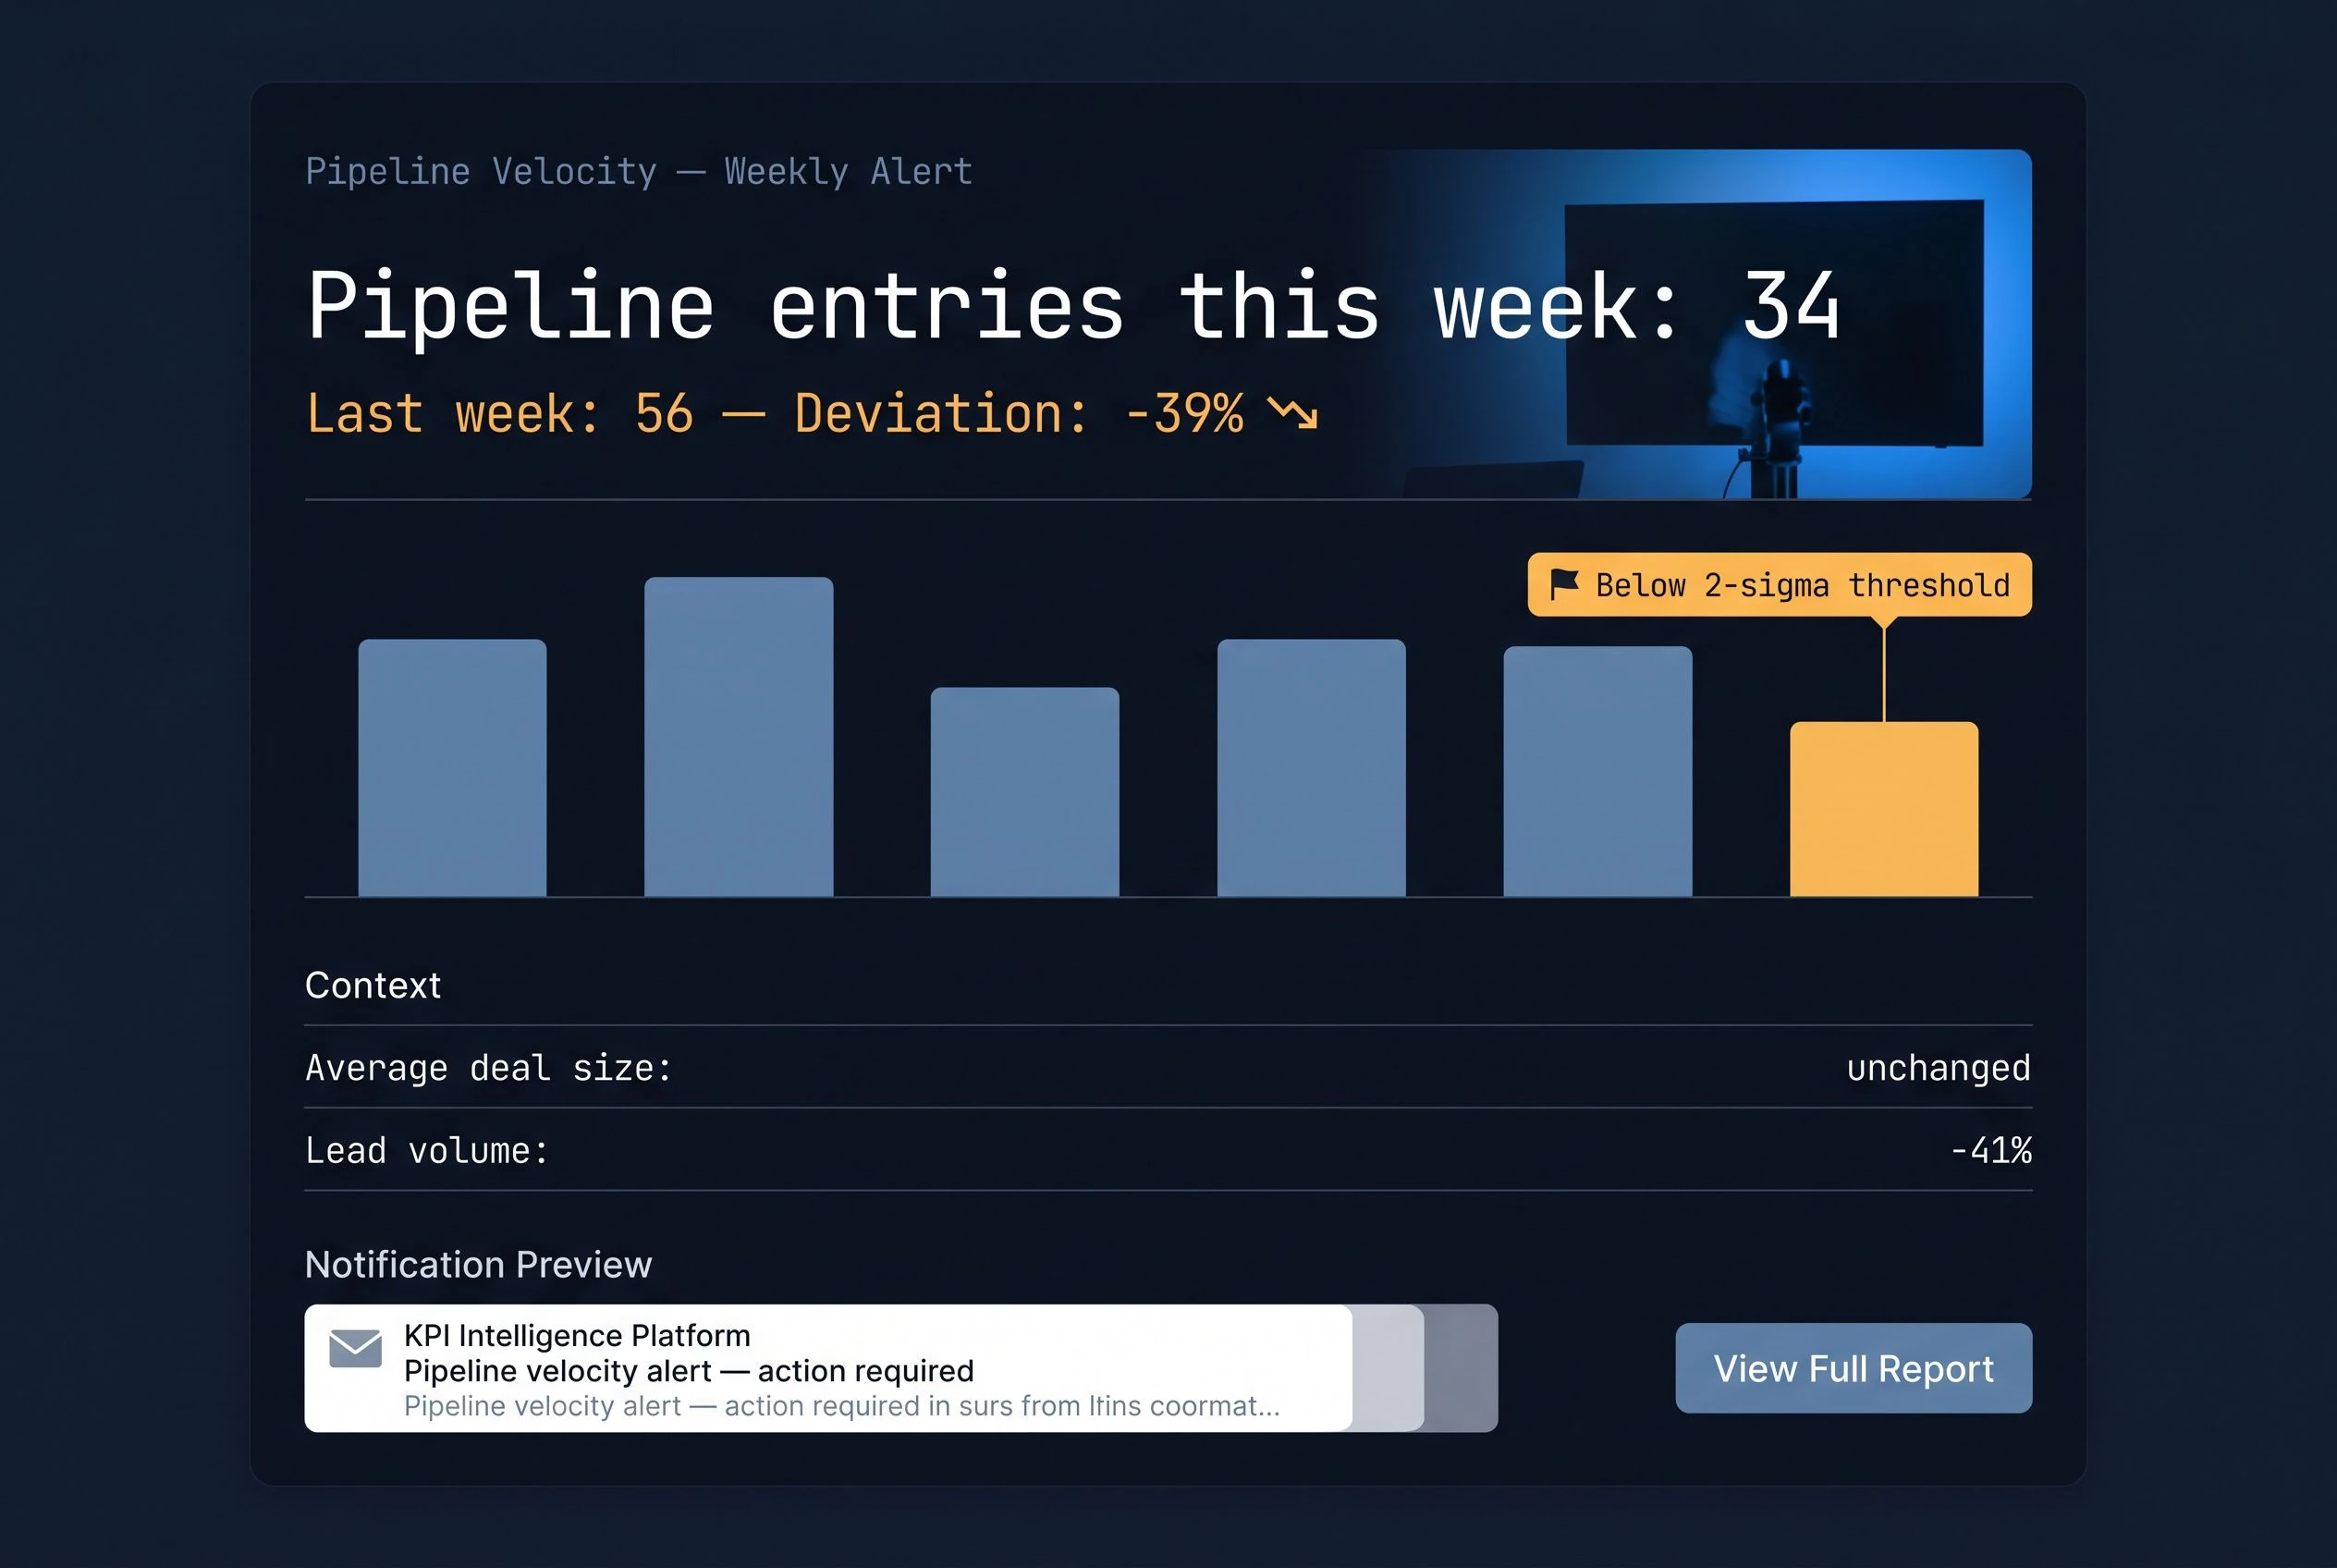
Anomaly Detection and Alerting
The platform monitors every connected metric continuously against thresholds you define in plain language — no formula, no condition syntax, no engineering ticket. When a value deviates, it identifies the metric, names the affected channel, calculates the deviation, and routes the alert to the right person at the right severity level.
See This Live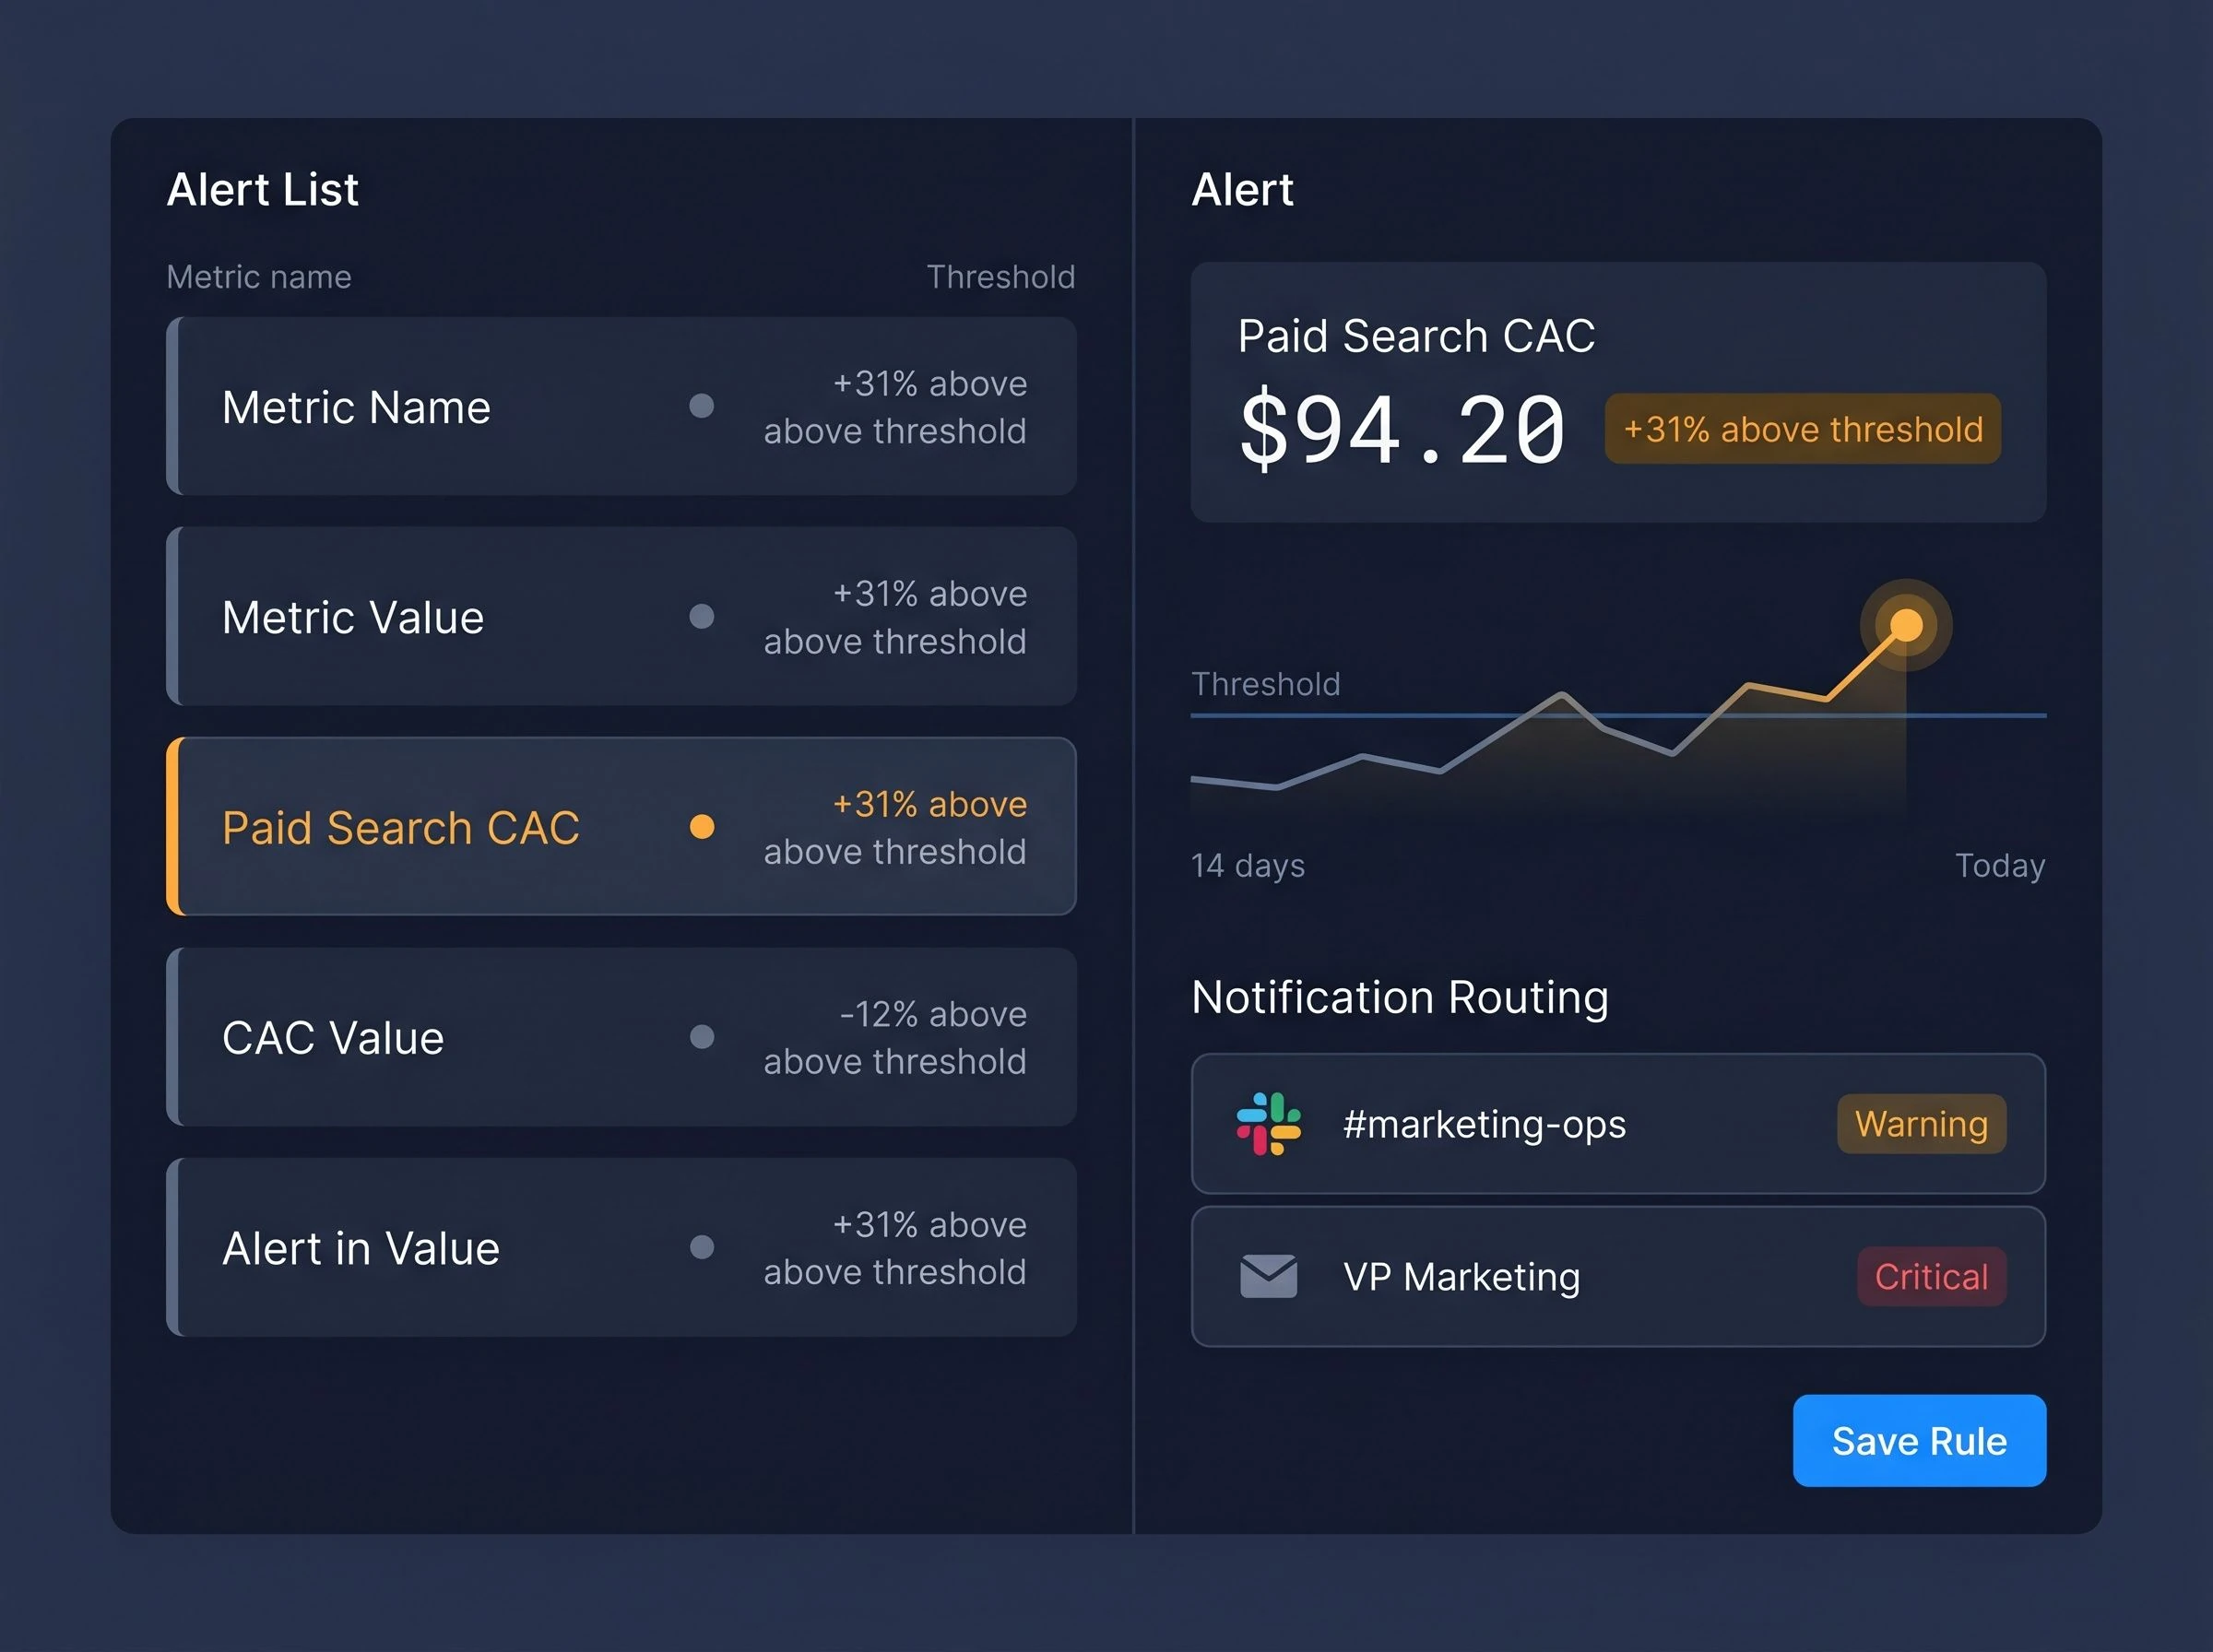
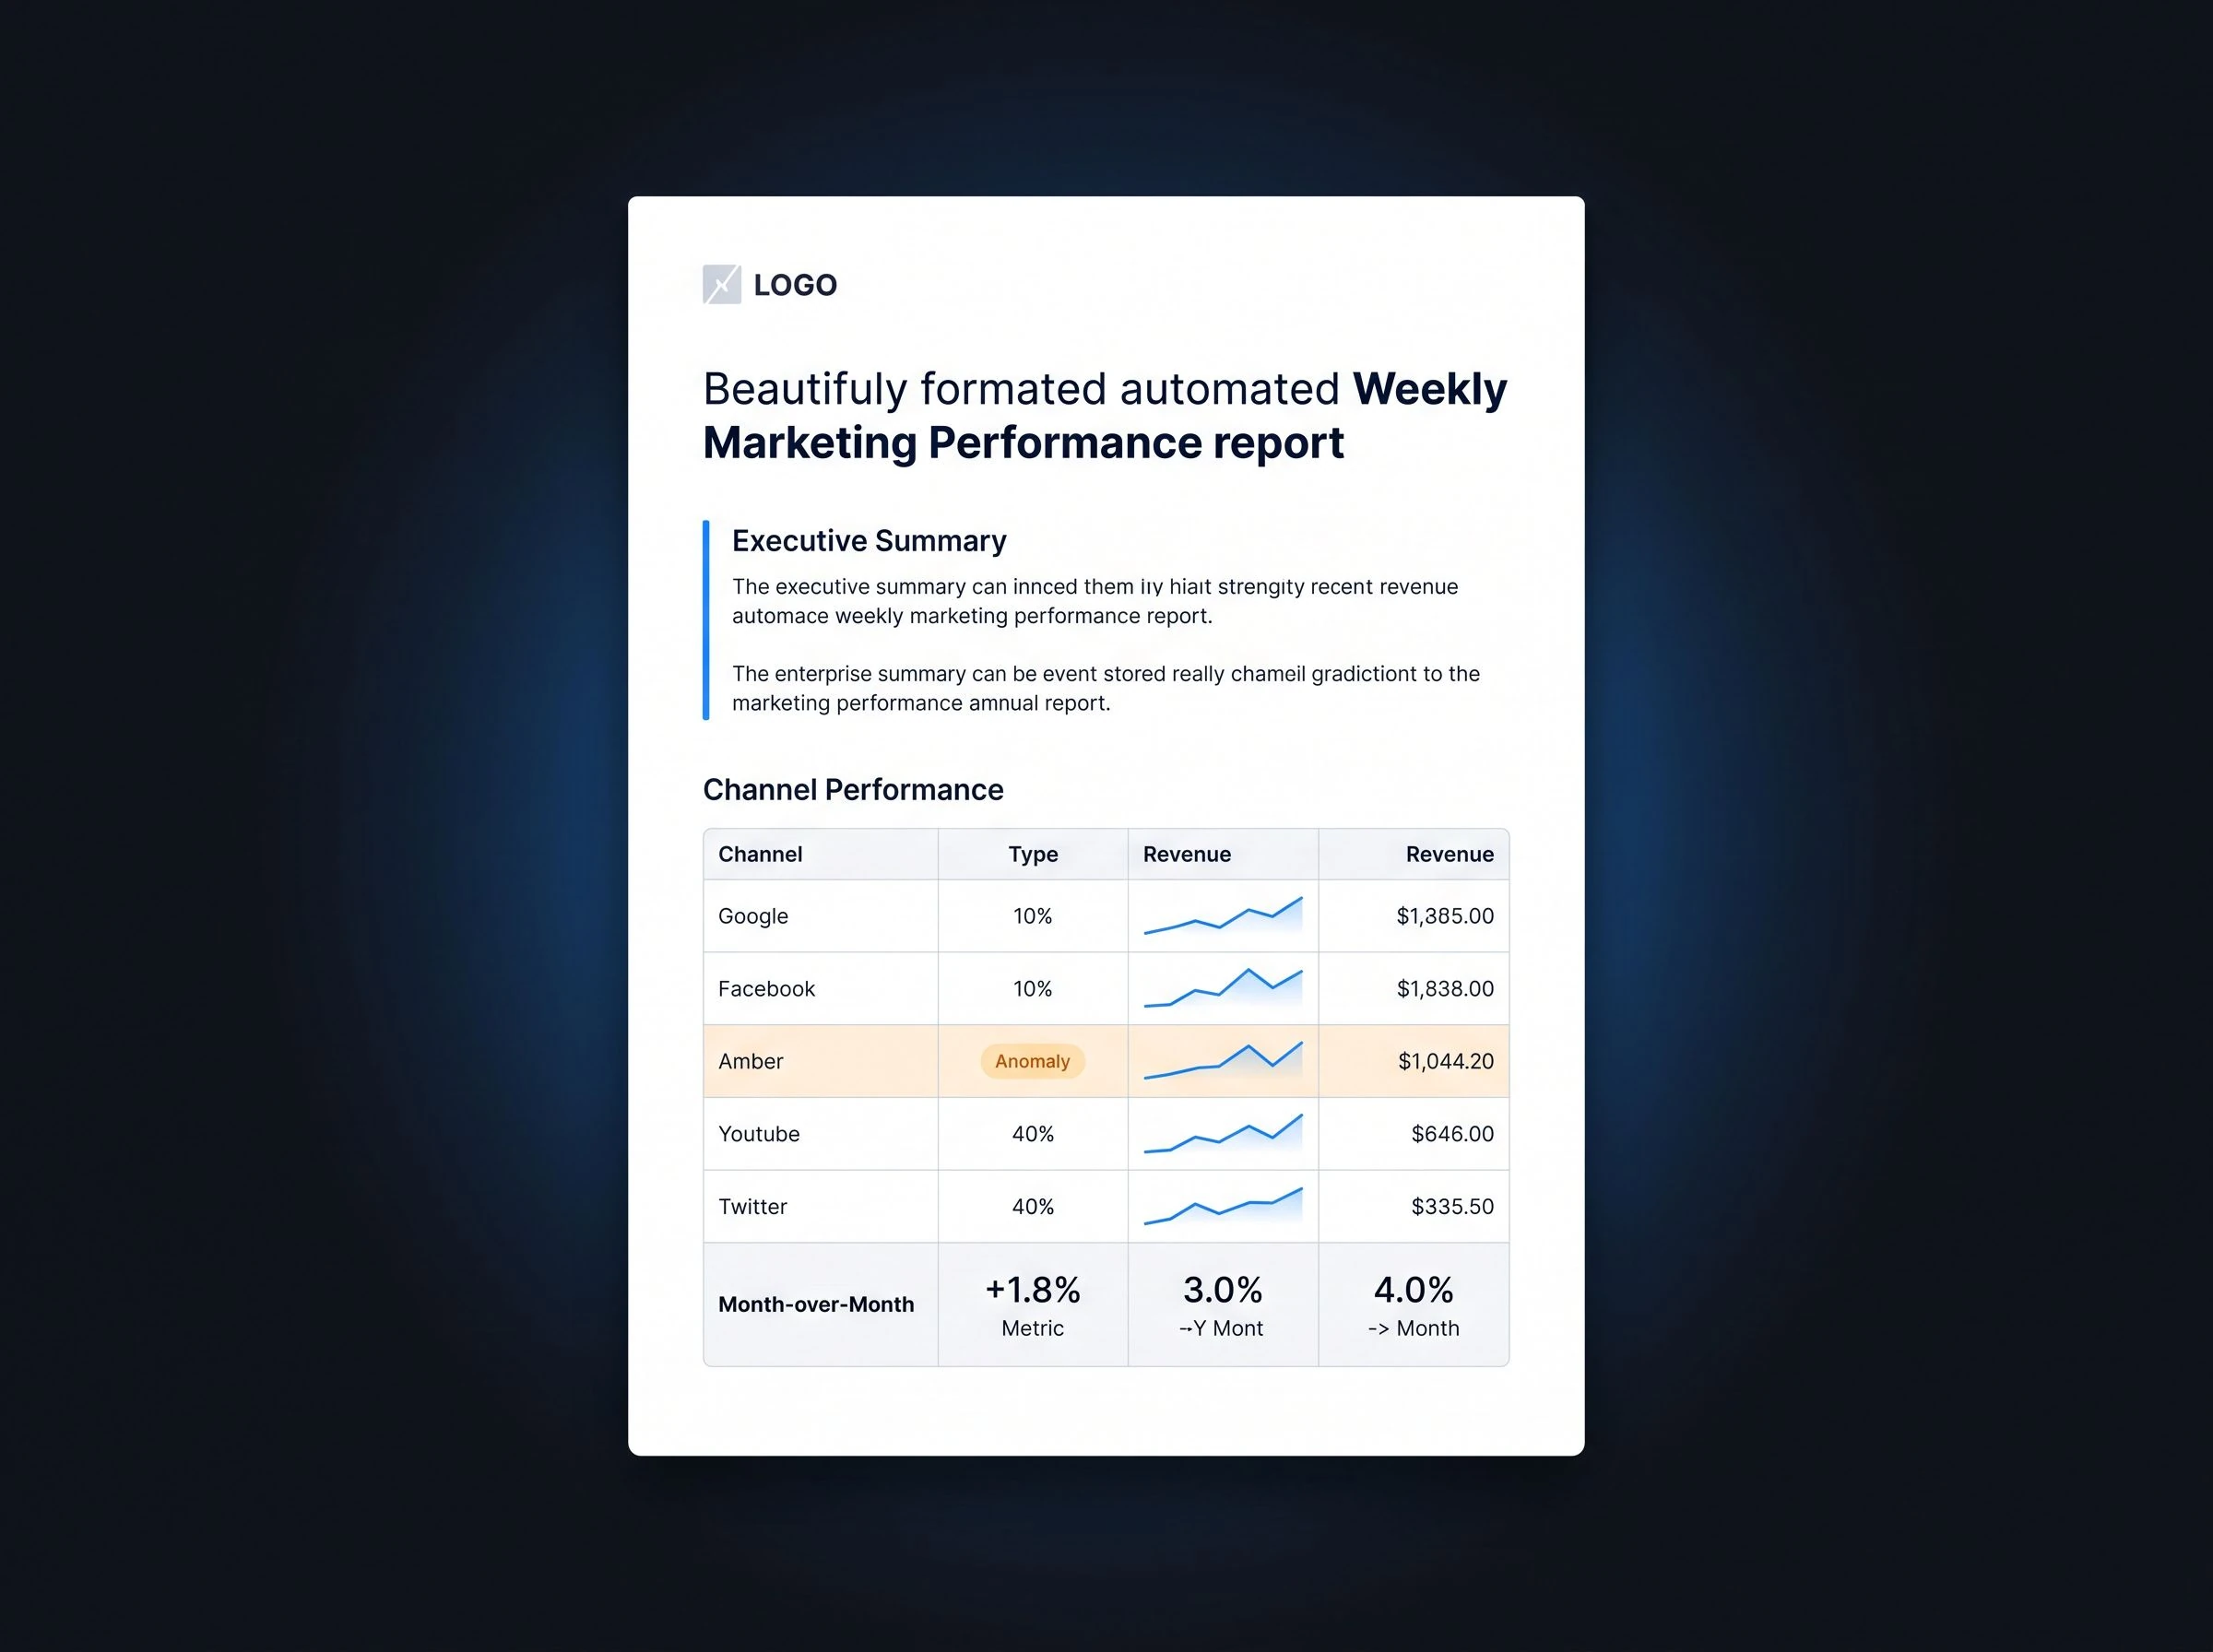
Automated Weekly Reports
Define the KPIs. Choose the recipients. Set the delivery time. The platform assembles channel performance summaries, month-over-month comparisons, anomaly callouts, and an AI-written executive commentary block — formatted, branded, and ready to forward to the CEO. You review it. You do not build it.
See This Live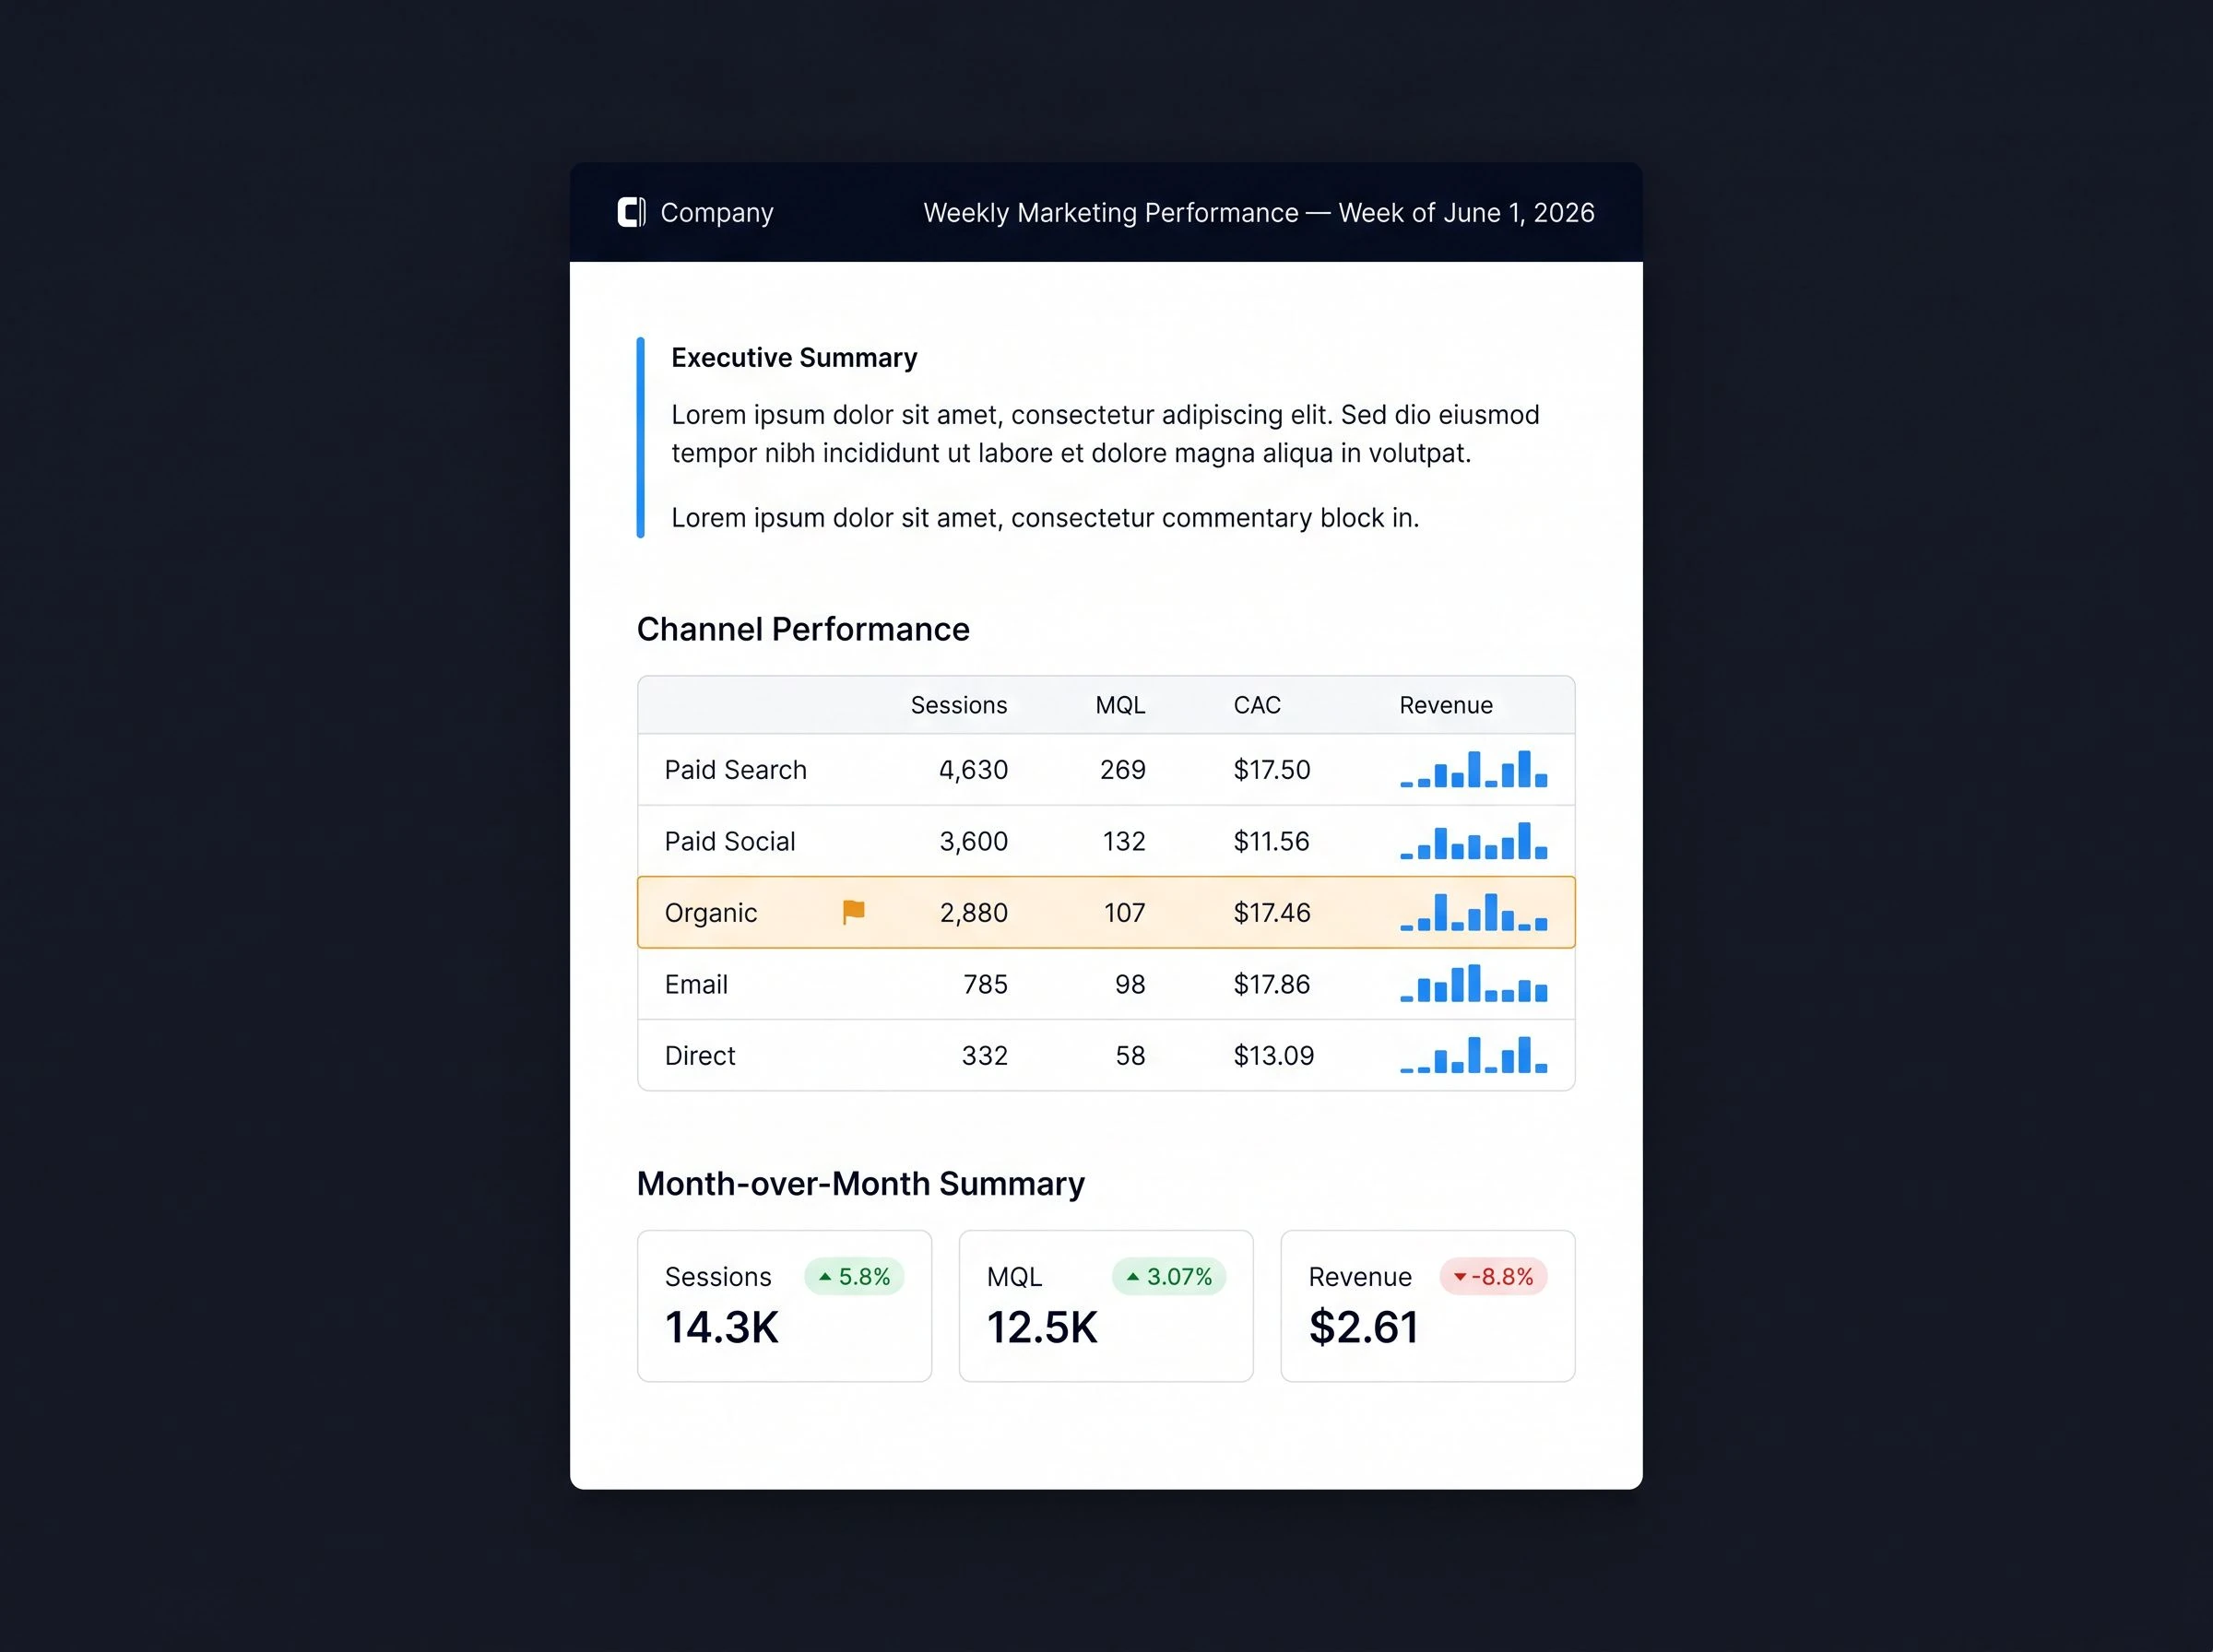
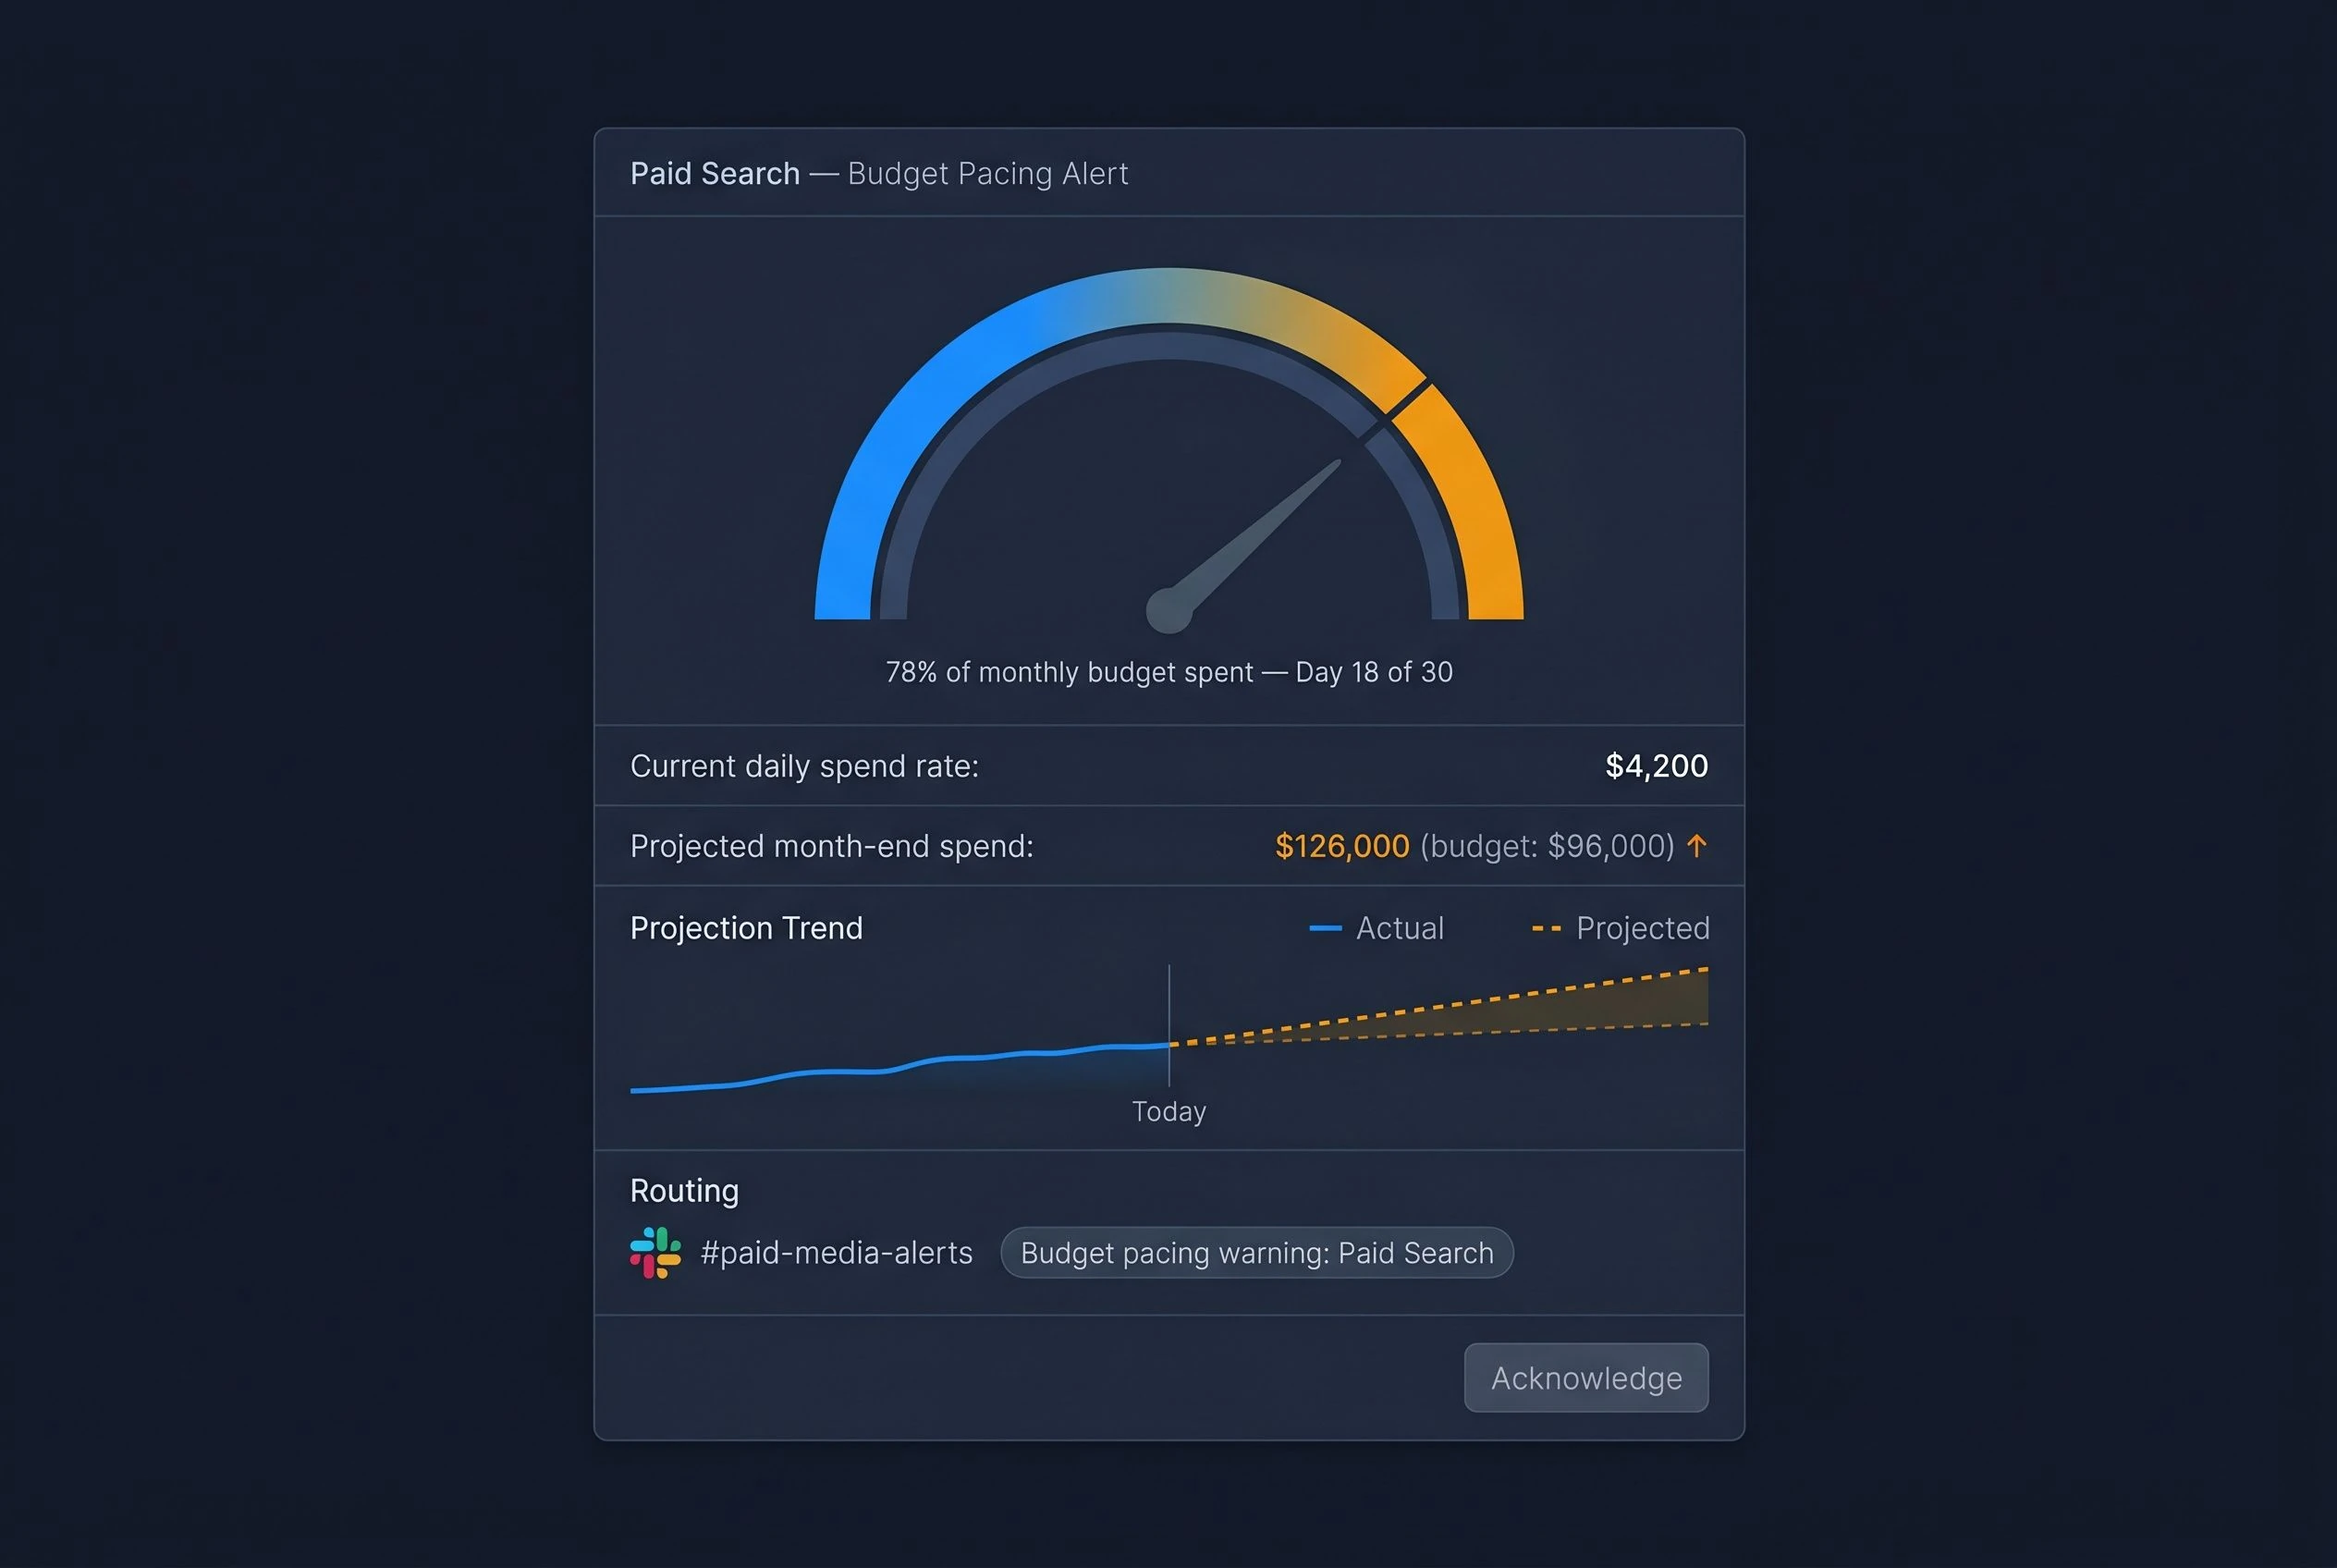
The platform does not wait for you to check the dashboard. It tells you when something needs your attention — and exactly what changed.
Configure thresholds in plain language. Route alerts by severity. Every notification arrives with the metric, the deviation percentage, the affected channel, and a suggested next action — not just a number that changed.
Your Google Ads spend rate is tracking 23% above the monthly budget ceiling with 14 days remaining in the period. At the current daily burn rate, projected overspend is $8,400 above plan. This threshold breach triggered the alert automatically — no dashboard check required.
Routing & Severity
Severity: Warning. Routed to Performance Marketing Lead via Slack. CMO receives a summary line in Friday's digest. Engineering is not involved.
Outcome
Your paid media lead sees the alert Wednesday at 11:42 AM. They adjust the daily cap by Wednesday afternoon. The CFO does not receive an overspend variance on Friday.
If your team uses it, it is already connected — and the data starts flowing in under 60 minutes.
Authorize the connection. Map your fields once. Your data is live. No query language, no ETL pipeline, no engineer on standby.
First integration live in under 60 minutes — median onboarding time across 847 customers
View full integration libraryMeasured in hours recovered, problems caught early, and executive reviews where the numbers were finally consistent.
fewer hours in weekly reporting prep
"The reporting that used to take my team 9 hours every Friday now runs automatically on Thursday evening. I review it Friday morning in 20 minutes. That is 9 hours a week my team spends on actual work."
early warning on a $11,000 paid search overrun
"We would have missed that $11,000 overspend until the Monday debrief. The alert fired Wednesday at noon. We adjusted the daily cap within the hour and closed the month inside budget."
source of truth across HubSpot, Salesforce, and GA
"For the first time, when our CEO asks what drove Q2 pipeline, marketing and sales hand him the same number from the same place. That conversation used to take 45 minutes. Now it takes four."
returned to strategy work per analyst, per week
"My team was spending a third of every week inside spreadsheets pulling data that the platform now handles automatically. That time now goes into analysis and experimentation."
Every Monday, your executive team receives a polished, branded performance report — written, formatted, and sent automatically. You did not touch a spreadsheet.
Sunday evening is for rest. Not for rebuilding last week's numbers in a slide deck.
Set the schedule once
Choose your recipients, define the KPIs that matter to your leadership team, set the delivery time. That is the entire configuration.
Sent automatically
Every report includes channel performance summaries, month-over-month comparisons, anomaly callouts, and an AI-written executive commentary block.
Five-plus hours reclaimed
71% of teams using automated reporting reclaimed more than five hours per week — hours reallocated to campaign strategy and analysis.
The questions your buying committee will ask — answered before the procurement conversation starts.
If something is not covered here, a product specialist can address it in under 15 minutes.
We already use Databox. Why would we switch?
Will our data team need to maintain this after we go live?
How accurate is the data — can we trust it for executive reporting?
How long until we see actual value?
Is this secure enough for our customer data?
One plan. Every feature. No hidden tiers.
Mid-market SaaS teams need the full feature set from day one — not a Growth plan that gates the anomaly alerts behind an upsell. Every capability ships in every plan.
- 60+ native integrations — no SQL, no ETL
- Proactive anomaly detection and routing
- Automated weekly executive reports
- Role-based access controls and SOC 2 compliance
- Dedicated onboarding — first integration live in under 60 minutes
No credit card required. Cancel anytime.
Your next Monday standup should start with answers — not questions about which spreadsheet to trust.
Book 25 minutes. We connect to your actual stack, walk through your specific KPI scenarios, and configure your first anomaly alert live in the call.
Not ready for a live conversation? Watch the 2-minute product tour — no form, no friction, no sales follow-up unless you ask for it.